The Ecology & Changes of the Amboseli Ecosystem:
Recommendation for Planning and Conservation by Dr. David Western
Amboseli Conservation Program
at African Conservation Centre, Nairobi
A report submitted to the Task Force for Developing the Amboseli Ecosystem Plan, September 14th 2005 (Revised 5th April 2007). To download this report as a PDF (2.2 mb), click here.
at African Conservation Centre, Nairobi
A report submitted to the Task Force for Developing the Amboseli Ecosystem Plan, September 14th 2005 (Revised 5th April 2007). To download this report as a PDF (2.2 mb), click here.
Introduction
This report is prepared for the Amboseli Task Force responsible for presenting an integrated land use plan for the Amboseli ecosystem. The landuse plan aims at fostering sustainable development in south-eastern Kajiado while ensuring the conservation of wildlife in Amboseli National Park and the larger ecosystem. The Task Force, chaired by the Amboseli and Tsavo Group Ranch Conservation Association (ATGRCA), was convened in March 2004 by a workshop of some 70 landowners, community leaders, Kenya Wildlife Service, government agencies and non-government conservation organizations. The Task Force was charged with submitting a draft plan to the workshop representatives in 2005. Several technical committees were established to assist the Task Force with the plan.
This report was submitted to the Science Committee and Planning Committee at the request of the Task Force. The report presents the broad conclusions of long-term animal and vegetation monitoring conducted by the Amboseli Research and Conservation Project, and recommendations for conserving the Amboseli ecosystem and Amboseli National Park. Together with technical contributions from other projects and subcommittees, the findings and recommendations will be jointly discussed by the Science and Planning Committees under the Task Force prior to the final draft plan being prepared by the Planning Committee.
The information in this report is submitted by the Amboseli Conservation Program (ACP). A substantial amount of the data and results have already been published in scientific and technical reports made available to KWS. These published results should be used as a basis for planning. Given the short notice and urgency of completing a draft plan, this report can do no more than summarize the key research findings relevant to the planning process for the Amboseli ecosystem and Amboseli National Park.
The evidence presented here shows that Amboseli National Park and, to a lesser extent, the large ecosystem, is already under severe threat and has lost much of its biodiversity. Plans are urgently needed to arrest and reverse the trends. I have therefore highlighted only those salient features and processes that govern the biological diversity, ecological integrity and resilience of the ecosystem. If the key ecological elements of Amboseli can be conserved in the face of the main threats identified in this report, there will little need for corrective management. If not, the level of planning and management needed to sustain Amboseli’s productivity and diversity will be insurmountable.
Changes in human livelihoods and settlement patterns and the implications for the Amboseli ecosystem have been published earlier in United Nations Environmental Program’s Africa Environment Outlook: Human Vulnerability to Environmental Change. The report entitled, Environmental Change and the Vulnerability of Pastoralists to Drought: The Maasai in Amboseli, Kenya (Western and Nightingale, 2004) is included as an addendum to make the findings and recommendations available to the Task Force.
Methods and Data Sources
Animal counts
The data in these reports comes from the long-term ecological monitoring program of the Amboseli Conservation Program.
Data on the numbers and distribution of wildlife, livestock and human activity in relations to environmental variables in the Amboseli Basin were collected by ground and aerial counts beginning in 1967. Similar data for the Amboseli ecosystem and its links to adjoining ecosystems were collected in the course of the Ilkisongo Monitoring Program based on aerial counts started in 1973 (Western, 1976a, Western, 1976b).
Counts of the Amboseli Basin cover 600km2. The counted area includes the 388km2 of Amboseli National Park and adjoining bushland areas to the north and south. The Basin numbers in this report treated as Park numbers, given the close correspondence. The Ilkisongo counts cover approximately 8,500km2. This area spans the entire migratory range of ungulates moving out of the Amboseli Basin during the rains and portions of overlapping ecosystems in all directions. The expanded area shows how the movement of the Amboseli migrants changes in response to drought cycles and human activity over time and in relation to adjacent ecosystems. The expanded area includes the Kaputei Section of Maasailand to the north, Chyulus Hills to the northwest, Tsavo West National Park to the east, Kilimanjaro to the south, the Ngaserai area of Tanzania to the southwest and the Matapatu Section of Maasailand to the west.
Habitat monitoring and vegetation dynamics
A baseline vegetation map of the study area was compiled in December 1967, based on Poore’s (1966) “successive approximation” technique. Twenty eight vegetation zones were distinguished from the aerial photos and ground surveys on the basis of species composition, structure and cover. The zones were mapped on the 1967 series 1:50,000 aerial photos as a first approximation (Western, 1973). Each vegetation zone and its boundaries was checked and adjusted by ground verification, then redrawn on a 1:50,000 UTM grid map of the region. The dominant plant species in each habitat were collected and identified at the National Museums of Kenya Botany Department. The composition of each zone was determined qualitatively by visual discrimination and by using step-point transects through representative areas. The results of the field surveys gave a first-approximation vegetation map of the study area.
Further refinements to vegetation boundaries were made over the following six months, during the course of regular monthly ground transects and aerial sample counts (Western, 1973, 1976a). The corrected boundaries proved to be robust for the purposes of studying large mammal distribution and movements in relation to environmental factors (Western, 1973, 1975). It soon became evident, however, that the vegetation zones were changing rapidly in some case, especially the woodlands. A separate study of the woodland changes was undertaken (Western and van Praet, 1973) and regular adjustments made to the vegetation map to reflect the changing composition and boundaries. Habitat changes were subsequently mapped every 5 years, based on field notes, aerial photos and aerial mapping flights in a light aircraft.
Some of the 28 vegetation zones mapped in 1967 proved too small to justify separate categorization. These zones were merged with similar larger zones, as described below, giving a total of 22 zones. Three new vegetation zones were recorded after 1967, giving a total of 25 over the 52-year study period. The 25 zones were later aggregated into 8 major habitats, based on physionomic type and animal utilization assessed in the course of monitoring animal distributions and movements (Western, 1973).
A retrospective vegetation map was drafted for 1950, based on 1:20,000 scale aerial photos taken that year by British Royal Airforce and made available through the British High Commission in Nairobi from archives in the UK. The 1967 aerial photos and vegetation map was used to identify and demarcate vegetation zones on the 1950s aerial photos. Numerous photos taken by professional photographers, wardens and visitors were consulted to check that the demarcated zones in 1950 were similar in composition to the habitats distinguished in the 1967 vegetation survey.
GIS mapping
The baseline 1:50,000 vegetation maps were scanned into Geographical Information System (GIS) UTM grid format. Each 5-year map was geo-referenced separately. The transformed images were loaded into Arc View, digitized using polygons and each given a numeric code associated with a particular vegetation zone. The boundaries for each vegetation zone were traced with a recorded error of 0.1%. The area of all vegetation zones was calculated for each time interval and analyzed in Excel for statistical significance of changes in all vegetations zones and 8 habitats.
Habitat diversity
Habitat diversity was calculated from the vegetation zones and habitat maps for the period 1950 to 2002 using the Shannon-Weiner index. The area of each zone and habitat used in calculating the index for each time interval was calculated from the GIS mapping analysis.
Pasture monitoring
Biomass and structural composition was measured at 13 permanent monitoring plots located across the 8 major habitats in 1976, then expanded to 19 plots in 1980. Each monitoring plot was marked by a stone cairn and later GIS referenced using a roving beacon, giving accuracy of <1m. At each plot herb-layer biomass was monitored every four to six weeks along 12 transects radiating out from the cairn (Western and Lindsay, 1984). The total plot area measured approximately 300m2. Herb layer cover was measured along each transect using the pin-intercept technique. Herb layer height was measured with a meter ruler. Total herb layer dry biomass was estimated using the product of cover and height measurements, based on the formula y=29.03x + 3.34 where y=biomass and x=height. Species composition of the herb layer was measured every one to two years at the peak plant growth using the same methods. Shrub and tree composition was measured simultaneously at each plot was measured using the exclusion quadrat methodology and an allometric equation to calculate biomass from plant height and canopy diameter measurements. Species composition analysis is not included in this report.
Vegetation dynamics
A number of studies under ACP look at the vegetation dynamics in the Amboseli Basin. Several of these studies have been published and more detailed work on woodlands, swamps and other studies are in preparation.
Trends in Wildlife and Livestock Populations The long-term monitoring program provides a large amount of data on the numbers, trends and spatial distribution of 15 species of large mammals at varying intervals and spatial scale. It provides similar data for livestock and human activity. The intervals and scales range from small fixed plots within the eight major habitats in which animals and pasture conditions are measured monthly, to monthly aerial total counts of the keystone species in the dry season concentration area. At the largest scale, the monitoring includes seasonal or inter-annual counts of the larger group ranches, the ecosystem and significant portions of adjoining ecological regions and national parks.
The data include numerous counts and distribution maps for each species at various scales. Some of the data has already been published elsewhere. I will focus this report on the main species trends and the large-scale dynamics relevant to these levels.
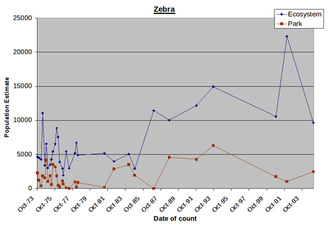
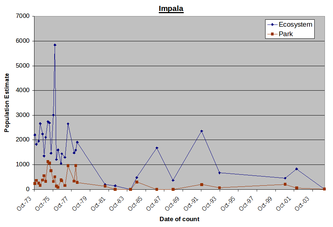
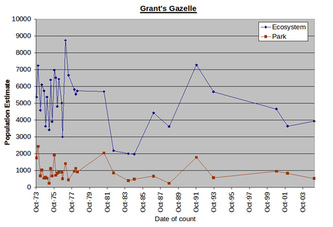
By way of illustration, Figure 1 presents counts for two migratory grazers, zebra and wildebeest, and two non-migratory browsers, Grants gazelle and impala for both the Amboseli Basin (essentially the park) and the Amboseli ecosystem.
The distinction between migratory grazers and sedentary browsers has a strong bearing on the structure and dynamics of the Amboseli ecosystem (Western, 1975). The distinction is used in this report for the purposes of highlighting the most significant ecological characteristics of Amboseli. The reasons are explained more fully in Wildlife and Livestock Distributions (next section).
Animal numbers in the Amboseli Basin oscillate considerably on a monthly basis, reflecting seasonal migrations into and out of the dry season concentration area. Numbers for the ecosystem fluctuate somewhat less seasonally but nonetheless show considerable longer term variation, reflecting both the high inter-count variance typical of the aerial sampling methodology used and some movement to and from adjacent ecosystems, depending on the distribution of rainfall.
Taking the variability into account, the overall trends in Figure 1 indicate that zebra numbers have increased steeply in the ecosystem and less sharply in the park. Wildebeest numbers have oscillated considerably and show no overall trend in either the park or ecosystem. Grant’s gazelle has stayed relatively stable in both the park and ecosystem. Impala numbers have decline precipitously to extinction point in the park and to a lesser extent across the ecosystem.
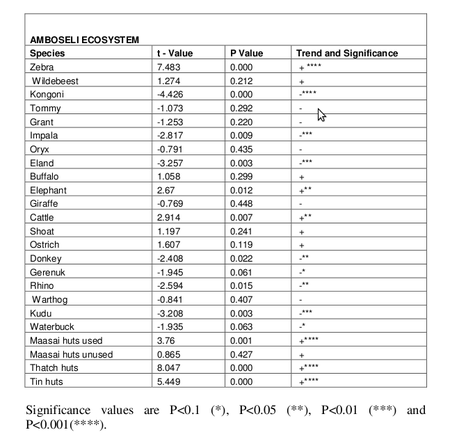
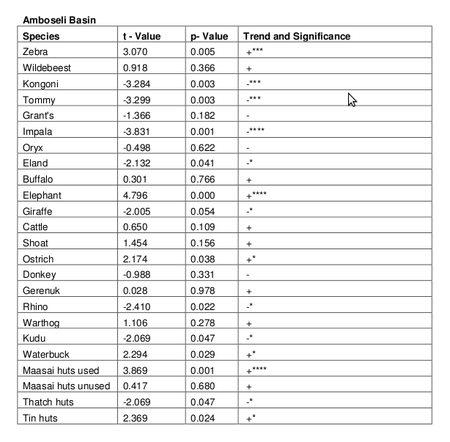
The trends in the numbers of each wildlife species, livestock and human habitation are summarized for the ecosystem in Table 1 and the basin in Table 2. Linear regression models were fitted using the Prais-Winsten Generalized Least Squares method. The direction and significance of the trend for each species over the last 32 years is shown.
Table 1. Trends in numbers for the Amboseli ecosystem for the period 1973 to 2005.
For wildlife, the ecosytem the counts show a significant increase in zebra and elephant and significant decreases in kongoni, impala, eland, gerenuk, rhino and kudu. For the pastoral community the counts show a significant increase in cattle and decrease in donkeys. The counts also show the overall number of Maasai settlements increasing for used traditional huts and for thatch and tin huts.
Table 2. Trends in numbers for the Amboseli Basin for the period 1973 to 2005
Table 2. Trends in numbers for the Amboseli Basin for the period 1973 to 2005
The Amboseli Basin counts show significant increases in zebra, elephant ostrich and waterbuck and a significant decrease in kongoni, Tommy, impala, eland, giraffe, rhino and kudu. For the pastoral community, occupied Maasai settlements have increased significantly, including traditional settlements, thatch huts and tin huts..
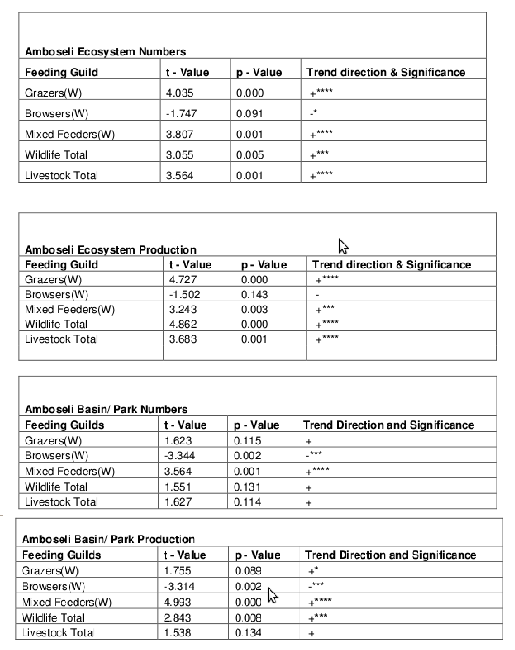
The ecosystem and Amboseli Basin counts can also be group according to animal guilds to illustrate changes in wildlife grazers, browsers, mixed feeders and in livestock. The results are summarized in Table 3.
Table 3. Trends in feeding guilds and production for Amboseli ecosystem and Amboseli Basin
The ecosystem and Amboseli Basin counts can also be group according to animal guilds to illustrate changes in wildlife grazers, browsers, mixed feeders and in livestock. The results are summarized in Table 3.
Table 3. Trends in feeding guilds and production for Amboseli ecosystem and Amboseli Basin
Table 3 shows that for the ecosystem, there has been a significant increase in overall numbers of wildlife, and for grazers and mixed feeders. There has been a downward but insignificant decrease in browsers. Livestock numbers and production have both increased significantly in the ecosystem. Changes in production for each of these groups match the changes in numbers, except that the production figure for browsers showing a significant negative decrease.
For the Amboseli Basin, the trends all lie in the same direction as the ecosystem, but a more pronounced decrease in browsers and insignificant increase in livestock. Wildlife numbers overall have not increased in number but show a highly significant increase in production. This largely reflects the strong increase in mixed feeders, dominated by elephants..
The Basin counts were used to derive a Shannon-Weiner index of diversity. The best fit regression was found to be y = -6E-05x + 3.10, r2 = 0.22, P = 0.064 for the period 1973 to 2000.
Wildlife and Livestock Distributions
In the interests of summarizing many hundreds of distribution maps, a few examples of individual species are presented, then aggregated into guilds and all-species range maps distill the key ecological features of the park and ecosystem.
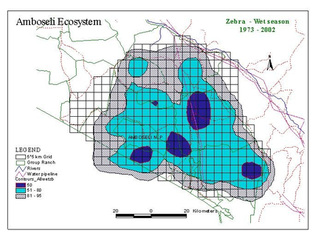
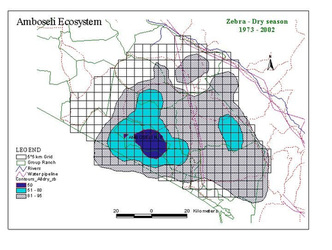
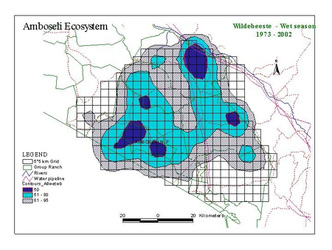
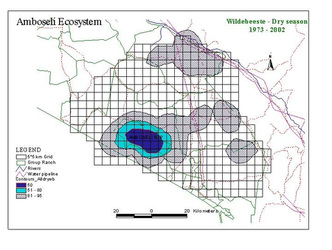
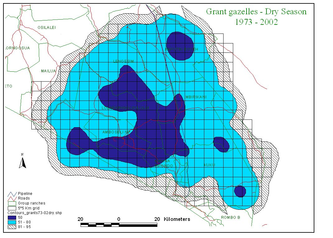
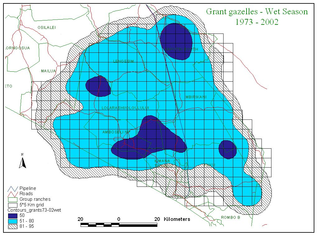
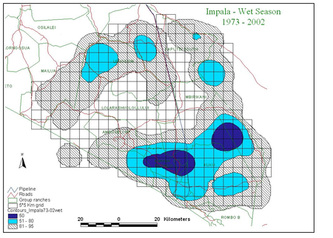
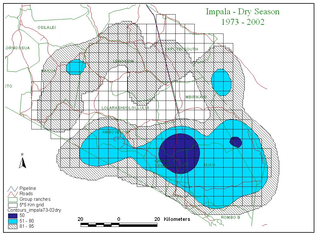
Figure 2 shows the distribution of zebra, wildebeest, Grant’s gazelle and impala summarized by wet and dry season counts for the last 30 years.
Several points are relevant to planning. First, the two migratory grazing species, zebra and wildebeest show large differences in wet and dry season distribution. They share the same dry season concentration area centered on the Amboseli Basin and, to a lesser extent, the swamps to the east of Amboseli (Namelok, Kimana, Lenker and Soit Pus). Wet season ranges overlap extensively and lie mainly north and northwest of Amboseli. Dry season ranges are far smaller than wet season ranges. They are also highly predictable. This predictability makes it easier to locate and plan for the conservation of the dry season range of Amboseli’s migratory ungulates. Wet season ranges are far larger and vary greatly in location, depending on the distribution of seasonal rains. This makes it hard to define a clear-cut wet season range or to demarcate meaningful corridors between dry and wet season ranges.
Second, the two browsers, Grant’s gazelle and impala, show little seasonal variation in distribution compared to the migrants. Grant’s gazelle is widespread, impala more confined to the woodland areas along the highland fringes and low-lying swamps of the ecosystem.
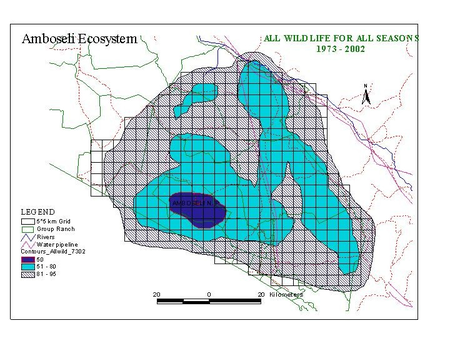
To determine the core range for the Amboseli ecosystem, all counts for all seasons for all species are combined into a single composite distribution map (Fig. 3). The contour map gives a good statistical measure of the areas essential for maintaining the migratory species over extremes of climate over three decades, rather than narrow connecting corridors between seasonal ranges. The composite will be used as the basis of defining the Minimum Viable Area (MVA) for the Amboseli Park and ecosystem used as the basis of planning in this report.
Figure 3. Contour map of the consolidated distribution for all species and all seasons 1973 and 2002.
An explanation for the differences in grazer and browser distribution and movement has been documented previously (Western, 1975). The differences and ecological significance has proved robust over the last 30 years.
At the level of Amboseli National Park, the migratory grazers show highly seasonal movements in and out of the Amboseli Basin. The migrations have been linked directly to seasonal rainfall and water availability (Western, 1973). In short, the Amboseli Basin, and the national park in particular, is a seasonal refuge that sustains migrants through the dry season. The harsher the drought, the greater the concentration of ungulates in the park and basin (Western, 1973). The swamps are the habitat of last refuge and effectively serve as a drought refuge (see Animal-Plant Interactions, below).
The flux in zebra and wildebeest numbers is not so pronounced at the ecosystem level and does not correlate with seasonal rainfall. This is because the ecosystem encompasses the seasonal range of both species and the migrants in general. There is, nonetheless, some evidence that numbers in the ecosystem vary according to the distribution of rainfall in the adjacent ecosystems relative to Amboseli. This indicates that Amboseli is not entirely a closed ecosystem. It is sufficiently closed, however, that long-term oscillations in animal populations overall are broadly predicted by drought and rainfall cycles. Aggregated for all wildlife herbivores, production is related to rainfall over the previous one year with the best fit regression y = -5.2206x + 3929.8, P = 0.0272, where y = wildlife production, x = rainfall lagged by one year.
This implies that drought intensity, whether caused by natural cause or human impact (see below), will directly affect wildlife abundance. The non-migratory browsers, in contrast to the migratory grazers, show no significant seasonal change in numbers within the Amboseli Basin (Western, 1975). Because most of the browsers are territorial, distributions change little through the season.
Livestock movements of pastoralists associated with the Amboseli Basin follow the same seasonal movements in relation to rainfall shown by migratory grazers. Numbers are inversely related to rainfall over the previous 40 to 50 days (Western, 1975). As with wildlife, oscillations in livestock population at the ecosystem level are similarly related to drought and rainfall cycles, but more weakly so (y = -3116x + 14.829, P = 0.077, where y = logged livestock production and x = log rainfall lagged by one year.). This indicates that the ecosystem is more open for livestock than wildlife. Given that cattle are moved as far as Wakwapi areas in Tanzania during droughts, the weaker correlation is to be expected.
Traditional Maasai settlements are linked directly to livestock movements so it is not surprising that the distribution and movement of traditional Maasai pastoralists shadows that of wildlife too (Western, 1973). Human populations, in contrast, have not fluctuated with rainfall. To the contrary, they have climbed steadily regardless of rainfall cycles (see Change in Human Activity, below).
In summary, between 1967 and the mid-1990s, livestock and migratory wildlife shared much the same dry and wet season range and the same drought refuges in the Amboseli swamps. This traditional pattern largely prevails today, despite major changes in human activity across the ecosystem. The increase in human activity and change in lifestyles is, however, disrupting this traditional pattern at an accelerating pace. These changes and the threats to the integrity of the ecosystem and the viability of Amboseli and other national parks in the region are taken up under the section Changes in Human Activity below.
Habitat Change
The following section is a synopsis of an article in preparation on changes in the vegetation zone and habitats in the Amboseli Basin between 1950 and 2002. The article quantifies the area changes in 25 vegetation zones and 8 major habitats of the Amboseli Basin and gives GIS maps of the distributional changes by 5-year intervals. A description of the vegetation zones listed under the eight major habitats is given in the appendix. The following description summarized the findings.
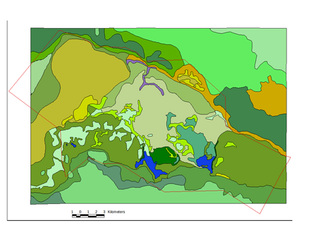
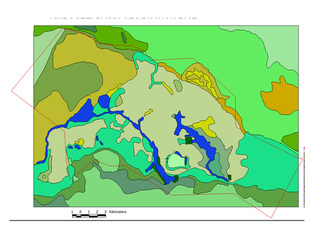
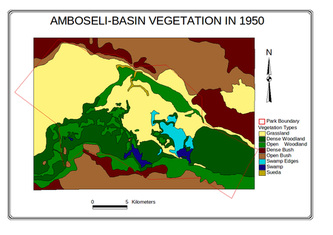
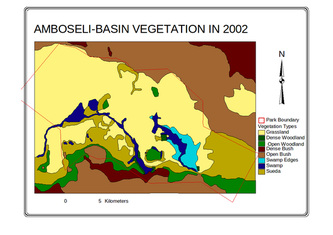
Maps of the distributional change in 25 vegetation zones and 8 major habitats mapped in the Amboseli Basin for 1950 and 2002 are given in
Figure 4.
Figure 4a-d (above). Changes in vegetation zones and habitats in the Amboseli Basin.
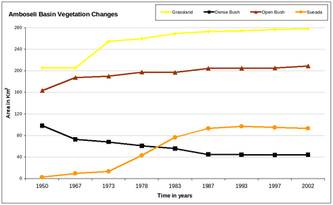
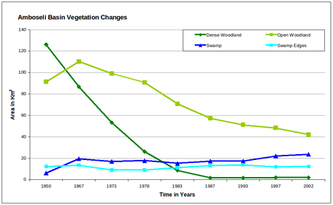
Figure 5a-b (above). Changes in the area of each habitat within the Amboseli Basin for the period 1950 to 2002.
The changes can be summarized as follows:
The dense woodland shows a steep decline to extinction by 1987. Open woodland initially increased as the dense woodland shrank, then declined steadily throughout the following 35 years and continued through 2002. Grasslands increased sharply in area between the 1950s and 1970s, then slowed but continued to expand steadily through the turn of the century. Sueada-Salvadora shrubland first appeared as distinctive vegetation zone in 1967 and expanded rapidly to the 1980s. In subsequent years it began a slow contraction. Dense bushland declined steadily from the 1950, losing half its area before leveling off in the 1990s. Open bush lands expanded steadily from 1950 to 1967, and then slowed to a steady increase in the following decades. The permanent swamps expanded to twice their size between 1950 and 1967, and then fluctuated until the early 1990s when they showed a second major expansion. The swamp-edge habitat fluctuated in area between 1950 and 2002 but showed no overall trend.
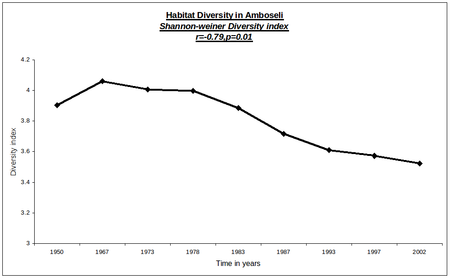
The changes have resulted in a steady decline in the habitat diversity. Figure 6 shows the change in habitat diversity, measured using the Shannon-Weiner Index, for the period 1950 to 2002.
Fig. 6. Habitat diversity index for the Amboseli Basin over the last half century.
After a small initial increase in diversity associated with the opening up of the dominant dense woodlands, habitat diversity has been in steady decline for the over 35 years with no sign of reversal.
Conclusions
Results of the long-term habitat monitoring show that extensive changes have taken place in and around Amboseli National Park over the last half century. The aggregate changes can be simplified into three major patterns.
The vegetation changes are consistent with the trends documented earlier by Western and Van Praet (1973) and more fully by Western (1973). Based on aerial photography, Western (1973) showed a 75% decline in Acacia xanthophloea woodlands between 1950 to 1967 and projected the disappearance of the woodlands in the following decade. Western and van Praet (1973) concluded that woodland loss and replacement by xeric scrub and halophytic grasses was largely due to salinization of the Amboseli basin, triggered by increasing rainfall and a rising water table. The concentration of elephants in the protected area was considered a catalytic factor at the time, rather than a primary cause of the large scale and rapid habitat changes. Western (1973) later showed that the demise of the Acacia x. woodland was symptomatic of a widespread shift to drier (xeric) vegetation in the Amboseli Basin. The overall trend towards more xeric vegetation has continued.
The salinization hypothesis proved unsustainable during the severe droughts of the 1970s. The hypothesis predicts that woodlands should regenerate as water tables and salinity levels drop. Instead, woodland loss accelerated. Western and Maitumo (2004) subsequently showed through a 20-year multi-factoral experiment based on selective herbivore exclusion that elephants alone accounted for woodland changes. Neither climate nor salinity were significant factors. Adding to the negation of a climate-based hypothesis, Altman et al (2002 publication of the long-term rainfall records shows that there has been no significant rainfall trend over the last 30 years.
Until the mid-1980s changes in the size of the main Amboseli swamps were linked to regional changes in seasonal and long-term rainfall. The expansion of the Enkongo Narok-Simek swamp in the late 1950s was attributed by wardens at the time to tectonic movements. More likely, the increase stems from a decadal increase in rainfall (Lamb, 1966) that led to a rise in water table across the entire Amboseli Basin and an expansion of Longinye Swamp as well as Enkongo Narok-Simek (Western, 1973). The contraction of the swamps in the 1970s corresponded to severe drought. However, further expansion after the late 1980s does not correspond to any significant increase in overall rainfall. The expansion and extensive seasonal flooding was associated with one swamp, Longinye. Other swamps showed no such increase. Professor Mifflin, in a consultancy report to KWS in 1993, attributed the expansion and flooding of the Longinye Swamp to internal re-channeling associated with vegetative changes.
Other observations add weight to this view. Expansion in response to rainfall lagged by several weeks after the onset of the rains in the 1970s, then abruptly shifted to a lag of a few hours in the early 1990s. Furthermore, many small swamps have emerged in the former woodland areas since the 1970s and the structure and composition vegetation has changed considerably. The tall sedges have been heavily grazed down (see Pasture Trends). Tall dominant sedges such as Cyperus immensus have been replaced by small sedges.
A plausible explanation is that the loss of deep-rooted transpiration with the extinction of the woodlands, coupled with the depletion of dense sedge, has resulted in an elevated water table, swamp eruption and extensive seasonal expansion. A high-level electric fence designed to test this hypothesis by experimentally excluding elephants from an Ilmarishari swamp has shown recovery of the tall sedge swamp and some evidence of contraction since established in 2002. The ecology of the swamps is subject of a Ph.D. study by Sunita Sarkar under ARCP.
TO READ MORE, DOWNLOAD THE FULL PDF: CLICK HERE
After a small initial increase in diversity associated with the opening up of the dominant dense woodlands, habitat diversity has been in steady decline for the over 35 years with no sign of reversal.
Conclusions
Results of the long-term habitat monitoring show that extensive changes have taken place in and around Amboseli National Park over the last half century. The aggregate changes can be simplified into three major patterns.
- Woodlands contracted from 30% of the area to less than 10% and have been replaced Suaeda/Salvadora scrub and grassland.
- Denser bushlands fringing the Amboseli Basin have been thinned and supplanted by open bushland.
- Permanent swamps increased 3.5-fold in area and have spread northeast across the basin towards the lowest drainage point, the seasonal Lake Amboseli.
The vegetation changes are consistent with the trends documented earlier by Western and Van Praet (1973) and more fully by Western (1973). Based on aerial photography, Western (1973) showed a 75% decline in Acacia xanthophloea woodlands between 1950 to 1967 and projected the disappearance of the woodlands in the following decade. Western and van Praet (1973) concluded that woodland loss and replacement by xeric scrub and halophytic grasses was largely due to salinization of the Amboseli basin, triggered by increasing rainfall and a rising water table. The concentration of elephants in the protected area was considered a catalytic factor at the time, rather than a primary cause of the large scale and rapid habitat changes. Western (1973) later showed that the demise of the Acacia x. woodland was symptomatic of a widespread shift to drier (xeric) vegetation in the Amboseli Basin. The overall trend towards more xeric vegetation has continued.
The salinization hypothesis proved unsustainable during the severe droughts of the 1970s. The hypothesis predicts that woodlands should regenerate as water tables and salinity levels drop. Instead, woodland loss accelerated. Western and Maitumo (2004) subsequently showed through a 20-year multi-factoral experiment based on selective herbivore exclusion that elephants alone accounted for woodland changes. Neither climate nor salinity were significant factors. Adding to the negation of a climate-based hypothesis, Altman et al (2002 publication of the long-term rainfall records shows that there has been no significant rainfall trend over the last 30 years.
Until the mid-1980s changes in the size of the main Amboseli swamps were linked to regional changes in seasonal and long-term rainfall. The expansion of the Enkongo Narok-Simek swamp in the late 1950s was attributed by wardens at the time to tectonic movements. More likely, the increase stems from a decadal increase in rainfall (Lamb, 1966) that led to a rise in water table across the entire Amboseli Basin and an expansion of Longinye Swamp as well as Enkongo Narok-Simek (Western, 1973). The contraction of the swamps in the 1970s corresponded to severe drought. However, further expansion after the late 1980s does not correspond to any significant increase in overall rainfall. The expansion and extensive seasonal flooding was associated with one swamp, Longinye. Other swamps showed no such increase. Professor Mifflin, in a consultancy report to KWS in 1993, attributed the expansion and flooding of the Longinye Swamp to internal re-channeling associated with vegetative changes.
Other observations add weight to this view. Expansion in response to rainfall lagged by several weeks after the onset of the rains in the 1970s, then abruptly shifted to a lag of a few hours in the early 1990s. Furthermore, many small swamps have emerged in the former woodland areas since the 1970s and the structure and composition vegetation has changed considerably. The tall sedges have been heavily grazed down (see Pasture Trends). Tall dominant sedges such as Cyperus immensus have been replaced by small sedges.
A plausible explanation is that the loss of deep-rooted transpiration with the extinction of the woodlands, coupled with the depletion of dense sedge, has resulted in an elevated water table, swamp eruption and extensive seasonal expansion. A high-level electric fence designed to test this hypothesis by experimentally excluding elephants from an Ilmarishari swamp has shown recovery of the tall sedge swamp and some evidence of contraction since established in 2002. The ecology of the swamps is subject of a Ph.D. study by Sunita Sarkar under ARCP.
TO READ MORE, DOWNLOAD THE FULL PDF: CLICK HERE
